Extreme Heat And Migration: Insights From The Arizona Border
The US Southwestern border is increasingly recognized as one of the world's most perilous land crossings. Alongside the myriad challenges faced by undocumented migrants, extreme heatwaves have emerged as a formidable barrier. Recently, there's been an increase in deaths caused by extreme heat, as noted by U.S. Customs and Border Protection.
As a data reporter, I hope to provide more quantitative analysis and map visualizations to support these migrant stories. My project aims to understand how rising global temperatures affect migrant movements in this region. It will look at how water and emergency beacons are spread across the area, with the goal of finding ways to make the journey safer for migrants.
Firstly, here is some background. I gathered weather data from NOAA and migrant information from the International Organization for Migration (IOM) and used R to analyze them. As Figure 1 shows, from 2019 to 2023, during the hottest months of June to September, there has been a notable increase in deaths among migrants trying to cross borders without permission. So, how do rising temperatures influence migration patterns along the Arizona border?
We define missing migrants as individuals who attempt to cross borders without authorization and are later found deceased by non-governmental organizations (NGOs) or patrol officers, without definitive identification at the time of discovery. Heat-related missing migrants are those whose deaths are inferred to be caused by heat, after excluding known causes like violence or drowning.
Since data on missing migrants is difficult to obtain and the specific reasons for their disappearance are often unknown, I reached out to the International Organization for Migration and an Arizona local NGO, Humane Borders, for their datasets. To increase accuracy, I focused on missing migrant cases from June to September, the hottest months in Arizona. I also narrowed down the data to include cases that could be related to heat-related causes of death.
Figure 2 provides very rich information, through this map, we can get some facts about Arizona: 1) Arizona is characterized by limited water sources and cities concentrated in the central region. 2) Tucson has become one of the fastest-growing cities in recent years due to immigration. 3) It has two patrol stations. 4) Rescue Beacons are primarily located in the lower-left corner, in Yuma County.
I use the Heat Index and Geographically Weighted Regression (GWR) as the main methods for this research. For my research on the impact of heat, I initially planned to use temperature and other weather data. However, I realized that this data might not clearly show trends over five years.
Then, I discovered the Heat Index in a research paper. Heat Index made by the nonprofit First Street Foundation, calculates the heat risk facing each property in the contiguous United States over the next 30 years, the length of a typical mortgage, providing some of the most detailed nationwide estimates. It uses an average temperature value over seven years, making it a more objective choice for my project. To analyze the data, I'm applying a weighted approach to the Heat Index.
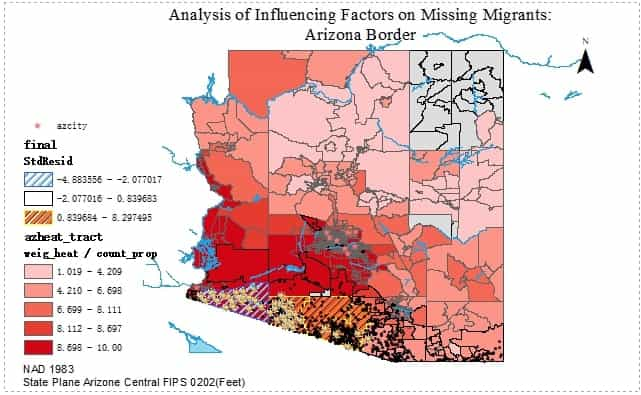
As the map indicates, the deep red areas represent the hottest regions, while the lighter colored areas are relatively cooler. However, it's important to note that when looking at the national map, Arizona tends to be overall warmer in the summer. The colorful points on the map represent missing migrants, with different colors indicating different years.
Finally, I conducted a Geographically Weighted Regression (GWR), combining factors such as heat, distance from cities, and the presence of rescue beacons, to see how they influence migrant safety. I gained some insights from the results. Migrants should avoid walking in the FID4, 1, and 51 census tracts to minimize health risks. Additionally, NGOs and the US Border Patrol should consider installing more beacons eastward to enhance safety.
So far, this is all my work. I sent the results to Humane Borders, hoping it can contribute to their efforts in helping undocumented immigrants protect their lives. Of course, this project has many limitations, such as my inability to verify the migrant data since statistics on heat-related deaths are hard to compile. Also, the heat index data was last updated in July, not including data for August and September.
In the future, I aim to extend the study to encompass the entire US southern border for a more comprehensive analysis.