Global Population Visualization
It’s another population project, but unlike the previous one, this time I aimed to visualize global population data. Creating an interactive globe was an ideal choice, allowing users to click and drag the globe to see population numbers for each country.
The geographic data we used is from 110m.json files. The data format is as follows:
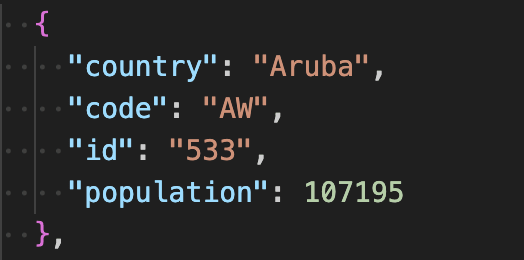
population change
Here, "id" represents the ISO code, which I'll use to link the data. This is more reliable than using the country name.
D3-Geo
I employed d3-geo for this project. D3-geo helps plot a set of values onto corresponding geographic locations. The general approach to using d3-geo involves four steps: 1) Create a projection function; 2) Create a path generator; 3) Render the country paths; 4) Add a globe.
Responsive
Similar to the bubble visualization, we just need to create a .chart-container and use a dimension binding equal to the width.
Styling the Globe
The next step is to add background color and fill the globe. I also added a subtle glow to the globe, achieved using an SVG drop shadow with feOffset, feGaussianBlur, and feMerge.
Adding Data to the Globe
We now have a globe, but the data isn't embedded yet. In addition to importing data, I created a color scale that adjusts the fill of each country based on population density. The brighter the color, the lower the population, and vice versa.
Rotating
This animation is a bit complex. I envision that when the user is not interacting with the page, the globe will automatically rotate. Once an interaction event is triggered, the user can drag the globe to explore different countries.
For auto-rotation, I use d3-timer. We're instantiating the rotation to be 0, and then updating it by 0.5 degrees every second.
For drag functionality, I use d3-drag. This module allows us to add drag events to any DOM element. It's worth noting that we set the rotation on the x-axis first—don't forget to add yRotation. Additionally, for a globe, adding inertia is better. I use a spring function for this; the spring works by taking an initial value and a set of options, including stiffness and damping.
Other works
To enhance the experience further, we still have many things we can do, like styling the cursor when the user is dragging the globe or adding interactive tooltips to provide more information.
global population